
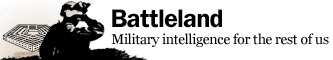


Winslow Wheeler is a Capitol Hill veteran who has turned himself into a pain-in-the-military-industrial-complex. He’s persistent and precise, two qualities that make what he says worth hearing. He issued some charts Monday (click on them to enrage) in what will no doubt be a vain effort to calm the howls now emanating from certain quarters over the alleged impending budgetary doom the Pentagon is facing.
“The first shows the DOD budget in current dollars since 1948 and looking forward to 2021,” he says of the chart above. “(`Current’ dollars are the amounts actually and planned to be appropriated). Note that even under the so-called`Doomsday Mechanism,’ the US ends up at a post-World War II high. (Also shown is the first phase of the Debt Deal — already agreed to by the Pentagon.)”
Then he runs those same numbers through his inflation wringer:
The second graph shows these dollars in DOD’s so-called “constant” dollars that purport to remove the effects of inflation and show spending where all dollars have the same value — normalized to the year 2012. Note that the “Doomsday Mechanism” would not put defense spending near any of its previous valleys, but instead well above any of them and quite flush with money in historical terms.

Honest people can disagree about whether or not we are spending too much on defense. But honest people cannot have that debate without showing charts like these to generals and lawmakers and suggesting: if this isn’t enough money to get the job done, maybe you need to find another line of work.